FINAL-YEAR PROJECT · DATA STORYTELLING
A visual analysis of UK number 1s
Adele and Bob the Builder each had two UK number ones in my 1952–2018 dataset. For my final-year project, I built an interactive essay about what reached the top of the chart, how long it stayed there and how it sounded.
When the playlist exposed the data problem
After a placement in BBC Visual Journalism, I wanted to make a visual story from scratch. I scraped Official Charts records with Python and looked up each single on Spotify to get measures such as danceability and energy for the recording.
When I turned the matches into a playlist, I found more than 50 karaoke versions alongside other mismatches. I rewrote the matching script in Node.js to search by title and artist separately, corrected chart metadata and checked for duplicate track IDs and missing audio features. I kept unmatched singles in the chart history and documented their absence from the sound comparisons.
From findings in R to charts readers could explore
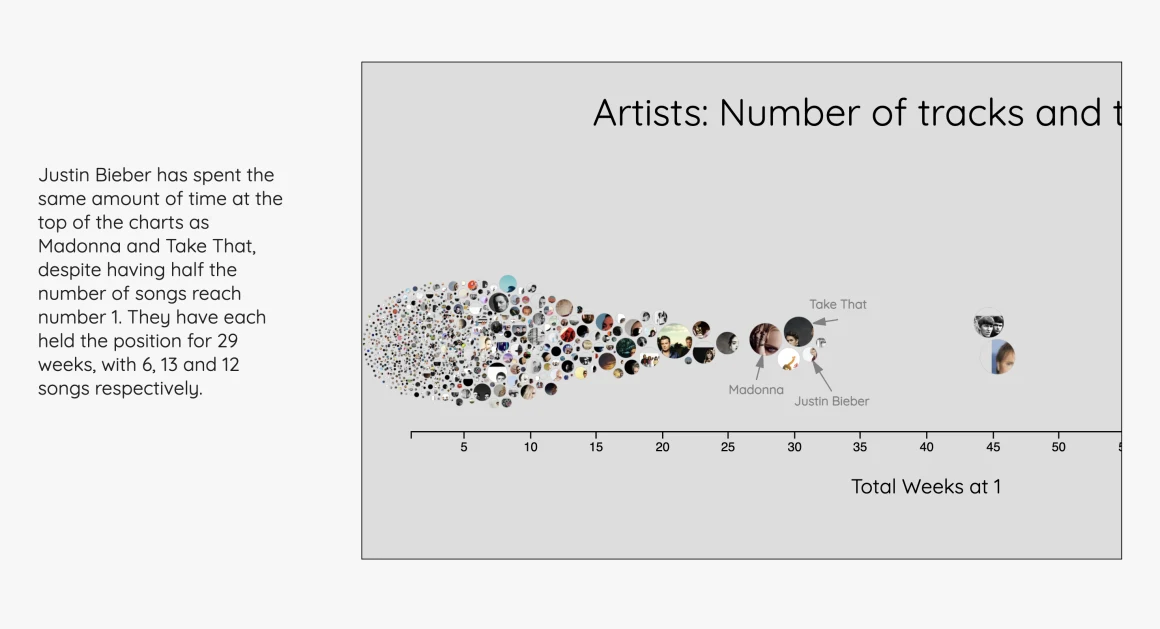
I used R to compare songs across years and grouped the findings on cue cards to work out the order of the story. I prototyped a swarm chart to compare artists and used a timeline to show singles that returned to number one after dropping away.
I built the essay with D3 and Scrollama. The charts changed as readers scrolled, bringing the points discussed in the text into focus. Track previews let readers hear examples as they explored the story.
What I’d change today
I wrote unit and browser tests for the original. Testing the colours for different types of colour vision deficiency also identified room for improvement. If I revisited it, I’d validate the matches before beginning analysis, prototype on mobile earlier, and add explicit chart controls and screen-reader descriptions.