BBC NEWS · DATA STORYTELLING
How much warmer
is your city?
Global temperature averages can be hard to relate to. We built an interactive BBC News story that let readers look up their city and see how temperatures had shifted in around 1,000 cities worldwide.
My contribution. I developed the scrollytelling charts, using Scrollama to synchronise D3 visualisations with the story as readers scrolled.
INTERACTIVE PREVIEW
From the global picture
to a city near you.
Switch between the global temperature map and the Brighton chart from the BBC story.
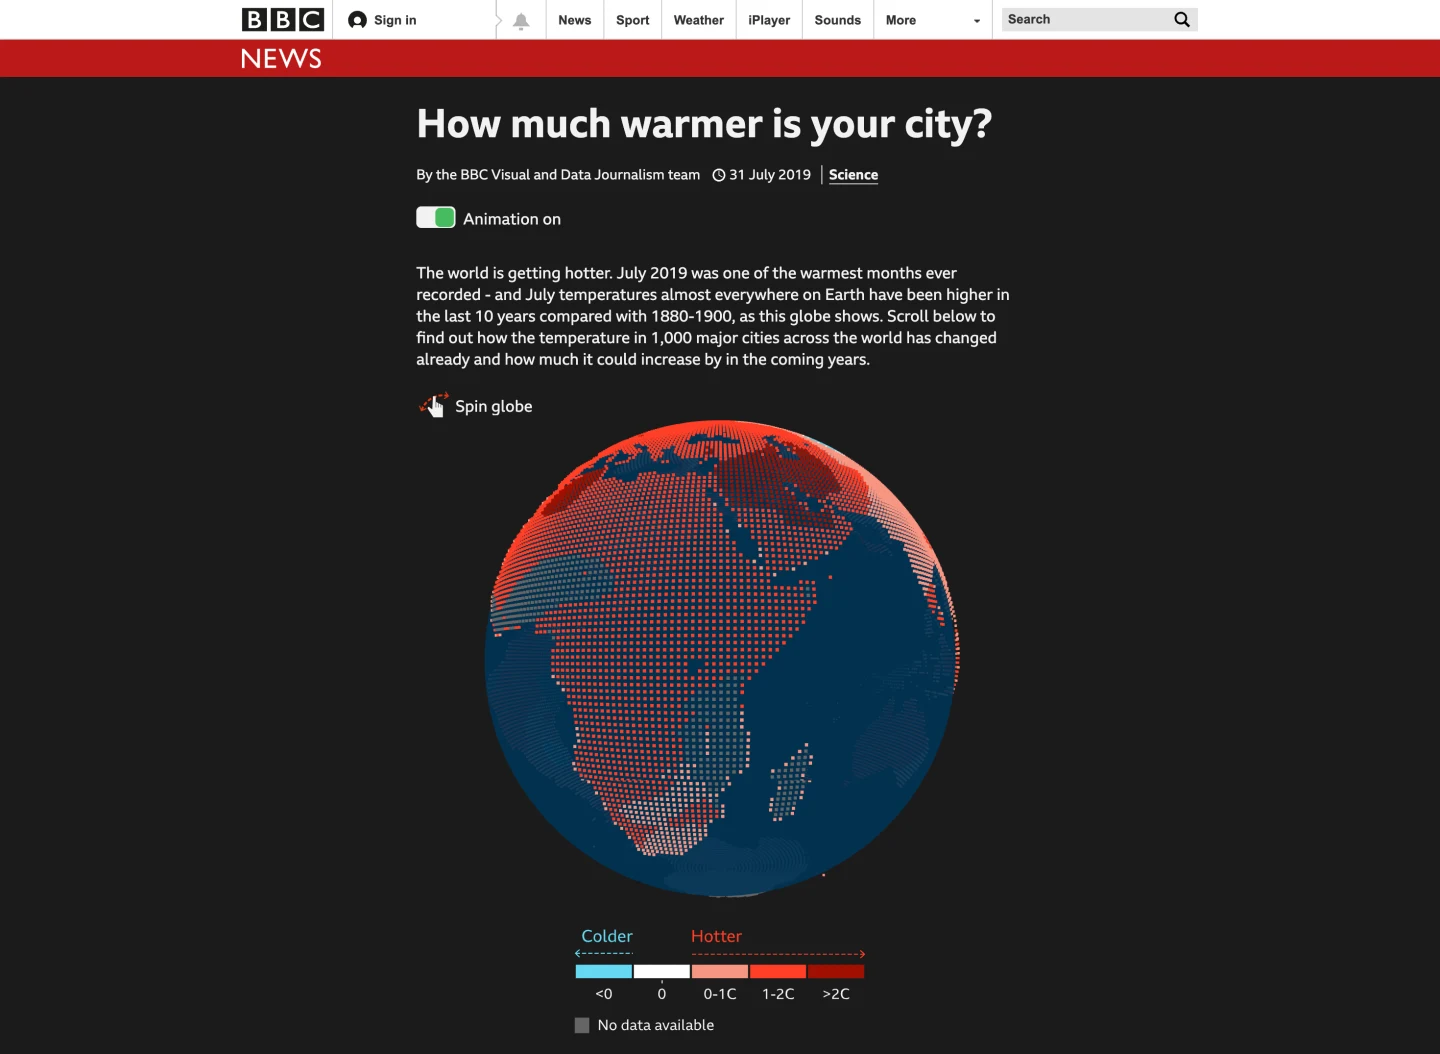 GLOBAL VIEW
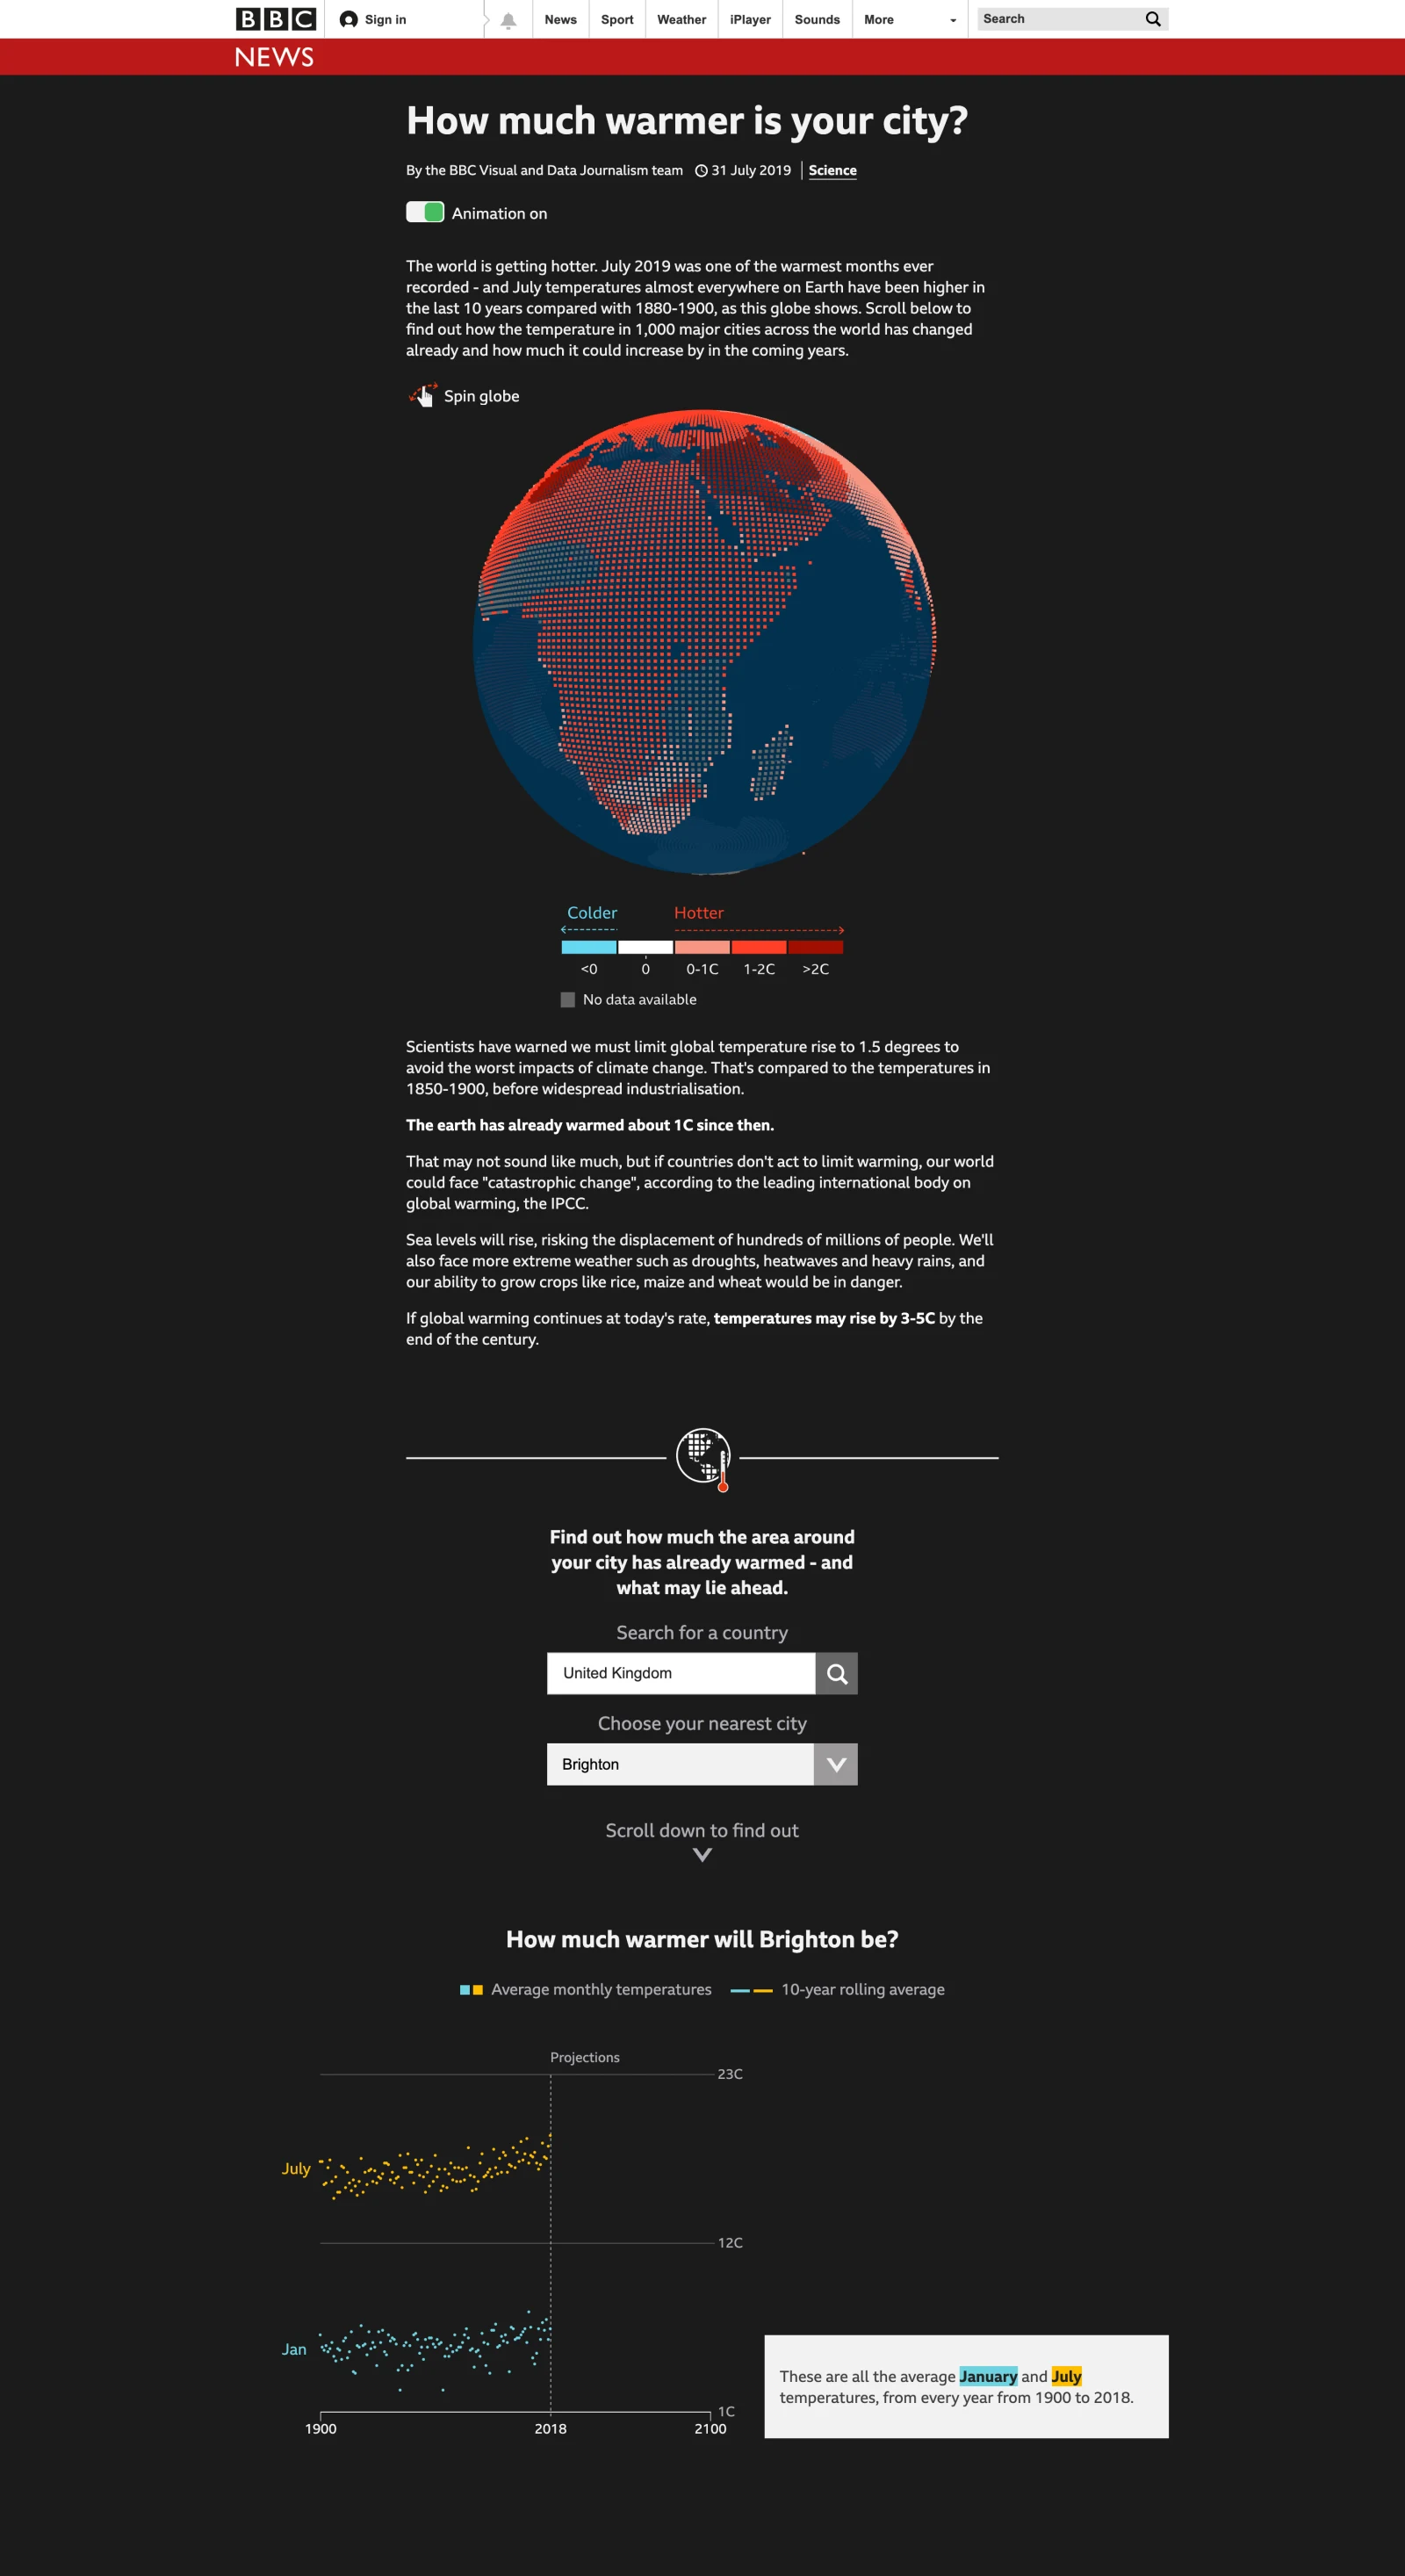
THE QUESTION
How do you make a global trend feel personal?
Climate change is often described through big global averages. For this BBC News project, we wanted people to see what the warming trend meant where they lived. The experience paired a city lookup with a visual story that let readers explore the data as they scrolled.
One story, many places and languages.
The team used one codebase to publish in 27 languages. The story loaded the globe data first and fetched city projections after a reader chose a place. That kept the city lookup useful on slower connections and let us take the same visual story to different language editions.
- Built the scrolly chart sequence and its transitions with D3 and SVG.
- Prepared data and assets to load in manageable chunks, and optimised imagery.
- Kept a useful path through the story when JavaScript was unavailable.
ACCESSIBILITY IN THE EXPERIENCE
Motion with an off switch.
The animated story needed to respect readers who prefer reduced motion. I worked with the team on an animation toggle and support for the operating system’s reduced-motion setting. The interactive also had to keep its meaning in the surrounding text and remain understandable with keyboard and assistive technology.
WHAT I LEARNED
Good scrollytelling is careful coordination.
The narrative had to work with motion off and stay understandable while the reader waited for data. Those constraints shaped how we paired the charts with text and what the story loaded first. I wrote about the implementation for the BBC Visual and Data Journalism team blog.