Oops! This content hasn't been optimised for mobile yet, please access from a laptop or desktop device.

A Visual Analysis of UK Number 1s

Becky Rush

This data visualisation project highlights the most successful songs in UK chart history.

Using data from the Official Charts and Spotify, it considers how certain attributes of songs have changed over time and showcases some of the most surprising songs to have made music history.

The UK Music Charts began on 14th November 1952

In the 3398 weeks between then and the 1st of January 2018, 1325 different songs have reached number 1

Of these, only 2 are held by Adele - the same number as children's cartoon character Bob the Builder.

Bob topped the charts with his signature song ‘Can We Fix It?’ for Christmas in 2000 and followed it up with ‘Mambo No. 5’ in 2001. Despite her album ’21’ going platinum, Grammy award winning super star Adele has also only had two singles reach number 1 in the UK charts - ‘Someone Like You’ (2011) and ‘Hello’ (2015).

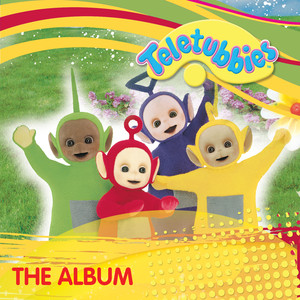
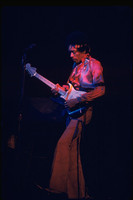
Music legends Jimi Hendrix and Prince both only hold one number 1 each - and so do the Teletubbies.
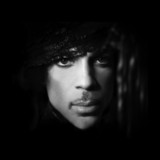
Surprisingly, Prince's only number 1 is 'The Most Beautiful Girl in the World'. 'Purple Rain', perhaps his most well known song, peaked at number 6.
Jimi Hendrix reached number 1 for just 1 week with 'Voodoo Chile' in 1970, whereas the Teletubbies were the 1997 Christmas number 1 with 'Teletubbies say Eh-Oh!', spending two weeks at the top spot.

Who topped the charts?

This graph illustrates how the weeks spent at number 1 are distributed between artists. The larger the bubble, the more tracks each artist has had.

Elvis is the King of the Charts, with 18 UK number 1s. The Beatles just miss out, with 17.

Unsurprisingly, Elvis and The Beatles have also spent the longest time at number 1, with 79 and 69 weeks respectively.

Other successful artists, in terms of most number 1s, include Cliff Richard (14), Westlife (14) and Madonna (13).

Frankie Laine has held the number 1 position for 32 weeks - the 5th longest lasting artist. Impressively, he did this with only 4 songs reaching the top spot. Whereas, the Shadows are in 4th position with 12 tracks lasting 44 weeks.

Wet Wet Wet have also held the position for a substantial amount of time (23 weeks) with only 3 tracks. This is thanks to the success of ‘Love is all Around’, which featured in the soundtrack of the 1994 film 'Four Weddings and a Funeral'. It lasted 15 weeks at number 1.

Justin Bieber has spent the same amount of time at the top of the charts as Madonna and Take That, despite having half the number of songs reach number 1. They have each held the position for 29 weeks, with 6, 13 and 12 songs respectively.

Explore the graph for yourself

Scroll over the graph to zoom, click and drag to pan.

Which tracks were most successful?

The songs which have lasted longest at number 1 are I Believe by Frankie Laine, which has spent a total of 18 weeks at number 1. This is closely followed by (Everything I Do) I Do It For You by Bryan Adams (16 weeks) and Love is All Around by Wet Wet Wet (15 weeks).

Although 'I Believe' was there for longer in total, it was knocked off twice (for only a week each time) before regaining the top spot.
'(Everything I Do) I Do It For You' holds the record for longest consecutive time at number 1. Bryan Adams spent an uninterrupted 16 weeks at number 1 - approximately 4 months! Wet Wet Wet were on course to beat Adams' record with 'Love is all Around' but halted production of the track before it could do so. In a 2015 interview with The Guardian, they said this was because 'It was just time to put the song to bed'.

Re-entries

A few songs strongly defended their position at the top of the charts - they may have been knocked off, but they regained the top spot multiple times. Five songs got to number 1 three times, 'I Believe' was one of them, but there was also Pharrell Williams’ Happy and Justin Bieber’s What Do You Mean?.

A couple of songs managed to reclaim the number 1 positions decades after they first conquered the charts. This includes My Sweet Lord, by George Harrison, and Queen’s Bohemian Rhapsody. The re-entries happened soon after both singers died, which is likely what caused the resurgence in the songs' popularity.

A few of Elvis’s most famous singles were rereleased in 2005 to mark his 70th birthday. Some of these (including Jailhouse Rock and It's Now or Never) reached number 1 again, over 45 years after they had first topped the charts.

Audio Features

Spotify attaches a variety of attributes to each of the songs in their library. Described as ‘audio features’, these include danceability, valence (‘feel goodness’), energy, acousticness and loudness.

The attributes are generated by EchoNest, who employ a range of techniques to quantify them. For example, danceability is calculated by considering overall tempo and beat strength, whereas valence used the opinion of a musical expert which was then expanded upon using machine learning.

The following analysis is based on the values provided by Spotify for the songs which have reached number 1. Five songs have been ommited The Chicken Song - Spitting Image
D.I.V.O.R.C.E. - Billy Connolly
Gym And Tonic - Spacedust
With a Little Help from my Friends - Sam and Mark
The Stonk - Hale & Pace & The Stonkers
as they are not available on Spotify.

Danceability

Spotify describes danceability as 'how suitable a track is for dancing based on a combination of musical elements including tempo, rhythm stability, beat strength, and overall regularity.'

The most danceable songs that have reached number 1 are Ice Ice Baby by Vanilla Ice and Give It To Me by Timberland, Nelly Furtado and Justin Timberlake.

Arguabley, Justin Timberlake is the most danceable artist, holding both the joint highest danceable number one and the second highest (SexyBack).

Surprisingly, Eminem holds 3 of the top 10 - The Real Slim Shady (5th most danceable), Just Lose It (joint 7th) and Smack That (collaboration with Akon, joint 7th).

The least danceable song that has reached number 1 is Westlife’s You Raise Me Up.

Valence

Spotify describes valence as the musical positiveness conveyed by a track. 'Tracks with high valence sound more positive (e.g. happy, cheerful, euphoric), while tracks with low valence sound more negative (e.g. sad, depressed, angry)'.

The most ‘feel good’ song is Madness’ House of Fun, with a valence score of 98.5%. This is closely followed by Bucks Fizz ‘Making your Mind Up’.

The song with the lowest valence score is Amazing Grace, as performed by The Pipes & Drums & Military Band Of The Royal Scots Dragoon Guards followed by Celine Dion’s My Heart Will Go On.

Acousticness

The most acoustic song to reach number 1 is Whispering Grass by Windsor Davies & Don Estelle. I Believe by Frankie Laine and Mad World by Michael Andrews and Gary Jules follow closely behind.

The least acoustic ones are Manic Street Preachers' The Masses Against The Classes and The Hindu Times by Oasis.

Energy

Spotify describes energy in tracks as 'a perceptual measure of intensity and activity, ... energetic tracks feel fast, loud, and noisy'. Energy is measured by considering a multitude of features, including dynamic range, perceived loudness, timbre and general entropy.

The highest energy songs to reach the top spot are No Limit by 2 Unlimited with a huge 99.9% energy. Close behind with 99.7% is Mr Vain by Culture Beat and Ooh Aah... Just A Little Bit by Gina G with 99.6%.

The lowest scoring song, in terms of energy, is Albatross by Fleetwood Mac (3.82%).

How have Audio Features changed over time?

This graph shows how the mean average of a selection of the audio features has changed annually.

Acousticness

We can see that until recently, acousticness has generally been declining.

It reached its lowest point (on average) in 2009, with songs such as La Roux’s Bulletproof and Lady GaGa’s Bad Romance.

It then spiked in 2015 with more acoustic tracks taking the scene, thanks to artists such as Sam Smith and Justin Bieber.

Danceability

Danceability has generally been increasing over the years.

It peaked in 1983, with some danceable classics - including Michael Jackson's Billie Jean, Give It Up by KC & The Sunshine Band and Red Red Wine By Ub40.

Danceability plummeted in 1967, the year when songs including Nancy and Frank Sinatra's Somethin' Stupid and The Beatles' All You Need Is Love made it big.

Valence

There is less of an obvious trend for valence than other audio features, but it seems to have generally declined since the 60s.

It reached its highest in 1963, with songs such as From Me To You, by The Beatles.

Most number 1s had high valence scores this year. Even the lowest scoring ones quite happy - such as Cliff Richard’s Summer Holiday (which had the 3rd lowest valence score in 1963).

On average, the least feel good year was 1954, featuring songs such as Secret Love by Doris Day.

The least feel good year since 1954 is 1996.
Curiously, both of these were the years before the current Conservative prime minister was replaced.
(Churchill by Conservative candidate Eden in 1955 and Major by Labour's Tony Blair in 1997)

1996 saw some major events, including the Dunblane Massacre, the IRA bombing in Manchester, Charles and Diana divorcing and Take That splitting up.

Could it be that these events had an impact on the happiness of music produced that year?

Explore the graph for yourself

Scroll over the graph to zoom, click and drag to pan. Use the filters below to hide/show audio attributes.

How do your favourite tracks compare?

Use the dropdowns below to see how your most listened to tracks compare to the songs which reached number 1.

If you logged in with Spotify, then you can compare one of your top 20 most listened to tracks to any of the songs which have reached number 1, by one of the audio features discussed.
If you didn't log in, you can choose any two number 1 songs to compare.

All audio and artist imagery used throughout this article were provided by Spotify.
Data is based on number 1 songs listed in The Official Charts, combined with Audio attributes were gathered using the Spotify API.