FREELANCE · ENERGY DATA
Global Energy
Monitor dashboard
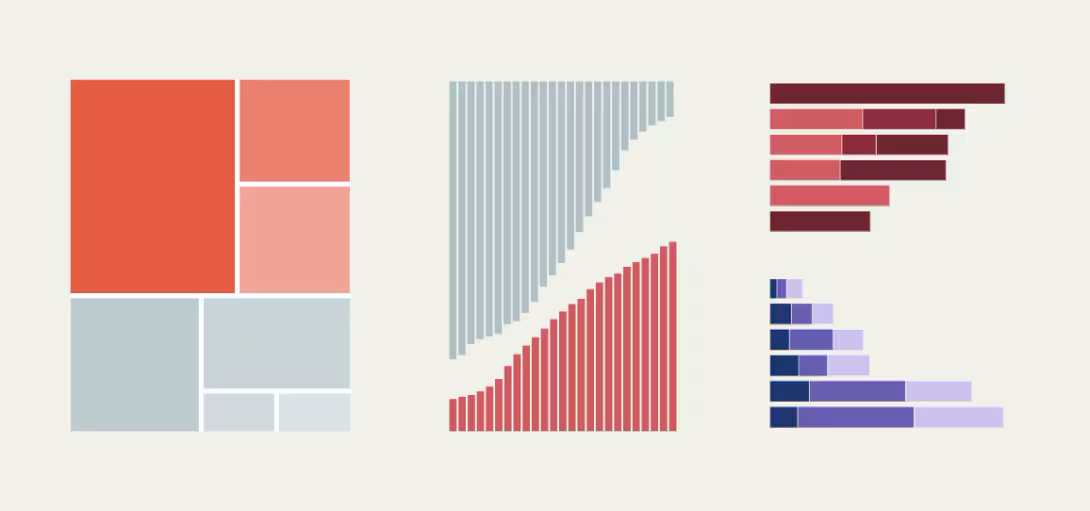
The Global Coal Plant Tracker dashboard helps readers explore power-plant data across connected charts. One filter selection can carry across the views they want to compare.
THE CHALLENGE
Help people see the whole picture.
Global Energy Monitor researches and publishes the tracker data. For the dashboard, readers needed to apply a filter once and compare results across several Flourish visualisations.
MY CONTRIBUTION
Connect the controls to every view.
I integrated the charts using the Flourish API. A reader changes a shared dashboard filter, the dashboard applies the selection through the API, and the connected charts show the filtered data. I worked through sorting and data-mapping edge cases so the views behaved consistently.
- Connected dashboard-level filters to multiple embedded visualisations.
- Worked through data sorting and mapping edge cases.
- Built a shared experience around a set of separately authored charts.
WHAT MADE IT INTERESTING
One interface, several data stories.
The Flourish API made it possible to combine chart experiences, but the dashboard still needed to make the relationship between controls and charts feel predictable. The project was a useful exercise in thinking beyond the individual visualisation: the product experience lives in how the views work together.
WHAT I LEARNED
Data tools need clear shared controls.
Coordinating filters across charts made the relationship between data and interface especially visible. It reinforced the value of thinking about the whole journey through the dashboard, and of treating sorting and filtering as part of the story people are trying to understand.